Working toward legislation to curb light pollution in Illinois.
 |
|

d current page: |
May, 2008 Chicago: A Lighting Case StudyTo explore real-world examples of outdoor lighting techniques, their effectiveness, and their costs, we present here an analysis of the street lighting operated by the City of Chicago. While Chicago is Illinois' largest city, it by no means is home to all of the state's outdoor lighting; the data shown below would be similar for many other municipalities (scaled to population size and area). The City operates a number of different styles of streetlight fixtures, installed over several decades of time; some of the more common types will be looked at in more depth. This study only includes streetlights operated by the City; it does not tally those on private property (parking lots, buildings), nor those operated by the Illinois Department Of Transportation (state and federal roads/highways). Figures on the total numbers of each type of lighting which the City operates were supplied by the Chicago Department of Streets & Sanitation, Bureau of Electricity, November, 2007. |
|
The scale diagram below illustrates the standard installation of this fixture type along city streets in Chicago, with the 20' poles spaced 45' apart. Presumably they were installed to light the sidewalks and adjacent roadway and parking zones, illustrated by the lighter gray zone under the center pole. But, the glass globes on the dual fixtures on each pole allow the energy output of the lamps to shine out in a spherical shell from the pole tops. Only about 37% of the light actually goes where it is needed. 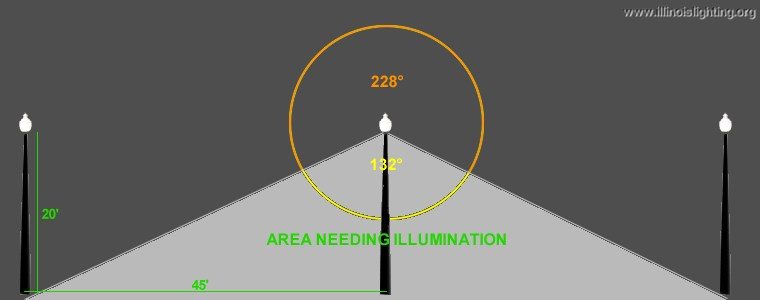 "Torch"-style street lamps as installed in downtown Chicago: While their energy/light output shines in all directions, just over a third of it goes to directly illuminate the sidewalks and street. An efficient, focused lamp fixture could provide the same level of illumination to the walkways and roadway while consuming less than half the energy, night after night, year after year.
|
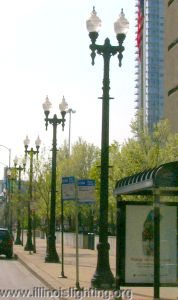 "TORCH"-STYLE STREETLIGHTS THROUGHOUT DOWNTOWN--
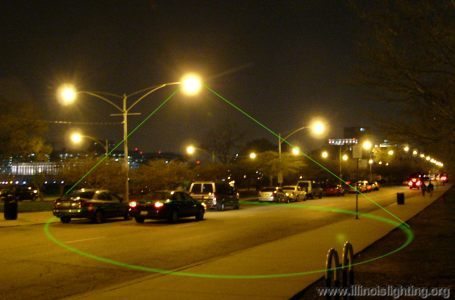
Fixture Type |
Arterial 400W |
Arterial 310W |
Residential 250W |
Residential, Pedestrian & Alley 150W |
Alley 250W |
Pedestrian 100W |
Pedestrian 50W |
Flood 400W |
||
Total Number |
17,560 |
68,342 |
21,478 |
78,107 |
58,632 |
2,730 |
7,892 |
892 |
||
Total Kilowatts1 |
8,148 |
24,945 |
6,658 |
14,494 |
18,176 |
355 |
521 |
414 |
||
KWH Per Year2 |
34,497,955 |
105,616,410 |
28,190,734 |
61,366,631 |
76,956,845 |
1,502,647 |
2,205,372 |
1,752,402 |
||
Lumens Output3 |
790,200,000 |
2,255,286,000 |
579,906,000 |
1,124,740,800 |
1,583,064,000 |
23,341,500 |
28,411,200 |
40,140,000 |
||
1 Wattage total includes lamp plus ballast for each high intensity discharge fixture. 2 Yearly kilowatt-hour total based on operating time of 4,234 hours per year. This is derived from the U.S. Naval Observatory's determination that Chicago experiences 4,417 hours between sunsets and sunrises each 365-day year, and subtracting 15 minutes past each sunset and before each sunrise for the period of twilight in which streetlights might not be turned on. 3Lumens output is based on the mean output over the normal lifetime for each lamp type; initial light outputs are considerably higher. |
||||||||||
|
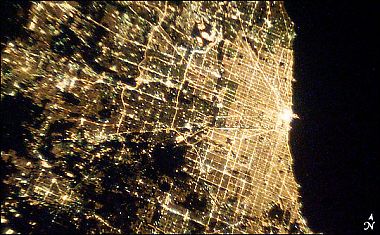
IF THE LIGHTING FIXTURES IN USE NOW ARE 30% INEFFICIENT, that represents the waste of: 4Total power draw, electricity consumed, light output and costs are computed assuming that all fixtures are operational, functioning within normal specifications, and only operating during nighttime hours 5C02 equivalence computed from national average for electrical generation, per The U.S. EPA 6For comparison, a 100W soft white incandescent light bulb puts out about 1,690 lumens 7Calculated from a cost of $0.0577/kilowatt-hour, the average rate which the City paid Commonwealth Edison for electricity during the first 3 months of 2008, per the Department of Streets & Sanitation, May, 2008. Millions Of Wasted Watts In One Snapshot
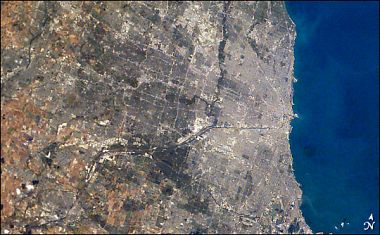
The photo on the right from the International Space Station (ca. 2003) shows not only some of the billions of stray, wasted lumens of light energy documented above, but also billions more from other irresponsible Chicago area outdoor lighting. This tidal wave of energy waste goes on hour after hour, night after night, year after year, and will do nothing but increase until reponsible lighting practices become the norm. |
Return to Page Top |
|||
|
|
|||
light pollution Illinois Chicago Cook County DuPage County Will County Springfield energy enviromnent global warming anti light pollution legislation lighting ordinances |
|||